How to Use Fibonacci Retracement for Crypto Price Predictions
How to Use Fibonacci Retracement for Crypto Price Predictions delves into the fascinating world of technical analysis, exploring how Fibonacci retracement can be used to predict price movements in the volatile crypto market. This guide will walk you through the basics of Fibonacci levels, identifying support and resistance, understanding trends, and ultimately, implementing this powerful tool into your crypto trading strategies.
Unlock the secrets of price action and discover how to leverage Fibonacci retracement to identify potential entry and exit points, all while acknowledging the inherent limitations and risks. This comprehensive guide will provide a practical approach to incorporating Fibonacci retracement into your trading plan.
Introduction to Fibonacci Retracement
Fibonacci retracement is a popular technical analysis tool used in financial markets, particularly in cryptocurrency trading. It’s based on the Fibonacci sequence, a series of numbers where each number is the sum of the two preceding ones. While seemingly mathematical, Fibonacci retracement levels help traders identify potential support and resistance areas during price movements. This tool is not a crystal ball, but a way to spot possible patterns and assess probabilities.The core concept is that after a significant price move, prices often retrace a certain percentage of the prior movement.
These retracement levels are based on the Fibonacci sequence and provide a framework for anticipating potential support and resistance. Understanding these levels can aid in making more informed decisions about potential buy or sell points.
Fibonacci Sequence and Levels
The Fibonacci sequence, originating from a 13th-century Italian mathematician, presents a unique mathematical relationship. Its application to financial markets stems from the observation that price movements frequently follow patterns that correspond to specific Fibonacci ratios. These ratios are derived from the sequence and offer potential support and resistance levels.Key Fibonacci retracement levels, often used in crypto analysis, include 23.6%, 38.2%, 50%, 61.8%, and 78.6%.
These percentages are derived from the ratios found within the Fibonacci sequence.
Understanding Fibonacci retracement for crypto price predictions is crucial, but the metaverse is shaking things up. Recent advancements in metaverse integration are dramatically altering how digital assets are used, as detailed in this insightful piece on How Metaverse Integration Is Changing Digital Asset Utilization Today. While these shifts are exciting, it’s still important to analyze historical data and use Fibonacci retracement to identify potential support and resistance levels for informed trading decisions.
Significance of Fibonacci Levels in Price Movements
These levels are crucial because they represent areas where price action often pauses or reverses direction. At these points, buyers or sellers may accumulate or liquidate their positions, leading to potential support or resistance.The 23.6% and 38.2% levels are often considered minor retracements. The 50% level acts as a neutral point, signifying a halfway point in the retracement.
The 61.8% level is considered a significant retracement, and the 78.6% level marks an even more substantial one.
Support and Resistance Levels in Fibonacci Retracement
Support levels are price points where the price is likely to find buyers, preventing a further decline. Conversely, resistance levels are price points where the price is likely to find sellers, preventing an upward move. Identifying these levels using Fibonacci retracement can help traders predict where price action might pause or reverse. These patterns can help predict price movements in the future, but are not guarantees.
Typical Fibonacci Retracement Levels
| Fibonacci Level | Percentage |
|---|---|
| 23.6% | 0.236 |
| 38.2% | 0.382 |
| 50% | 0.5 |
| 61.8% | 0.618 |
| 78.6% | 0.786 |
These levels, derived from the Fibonacci sequence, often act as areas of support or resistance in price charts, but they are not absolute guarantees. Trading decisions based on Fibonacci retracement should be considered in conjunction with other technical indicators and fundamental analysis.
Identifying Potential Support and Resistance Levels: How To Use Fibonacci Retracement For Crypto Price Predictions
Fibonacci retracement can be a powerful tool for identifying potential support and resistance levels in cryptocurrency markets. By analyzing price movements, traders can pinpoint areas where the price might find buying or selling pressure, leading to potential reversals or consolidations. Understanding these levels can help inform trading strategies and potentially improve decision-making.Identifying support and resistance levels using Fibonacci retracement involves analyzing significant price swings within a defined timeframe.
These levels are calculated based on the identified price swings and can be used to anticipate potential future price actions. By applying these tools, traders can identify potential areas of buying and selling pressure, which can help them make informed decisions about entry and exit points in their trading strategies.
Applying Fibonacci Retracement to Crypto Charts
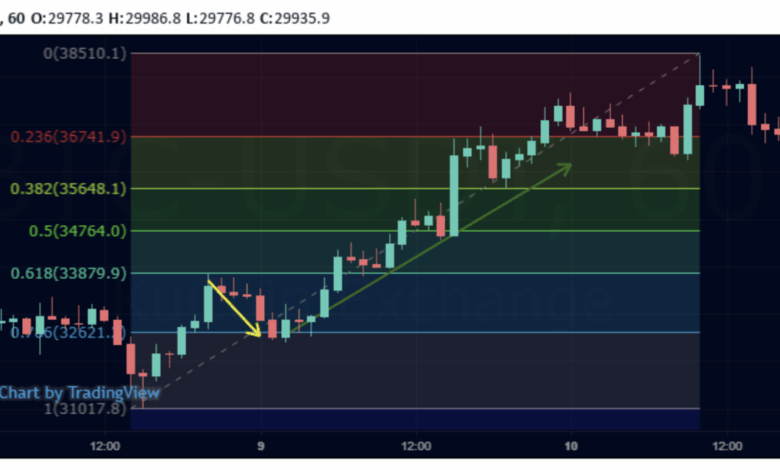
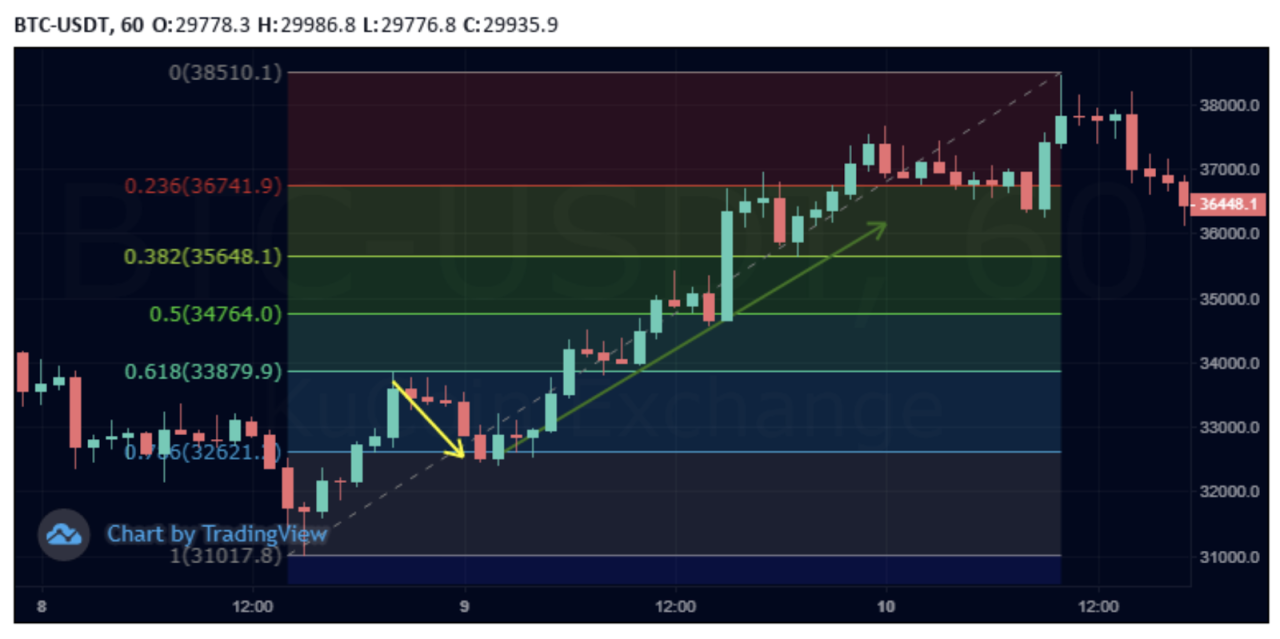
To illustrate, let’s consider Bitcoin. A significant price swing is identified, and Fibonacci retracement levels are drawn based on that swing. The swing’s beginning and ending points define the range for calculating the retracement levels. Commonly used levels include 23.6%, 38.2%, 50%, 61.8%, and 78.6%. These levels are marked on the chart.
The price may find support or resistance near these levels, and traders can monitor the price’s reaction to these points.
Choosing Appropriate Price Swings
Selecting the right price swing is crucial for accurate Fibonacci retracement calculations. For instance, if a trader identifies a major price surge in Bitcoin, a significant price swing (like a major bullish or bearish trend), the levels calculated from this swing will be more impactful than those from a smaller, insignificant price movement. Consider the historical context and the timeframe of the analysis when choosing the appropriate price swing.
Example: Bitcoin Price Analysis, How to Use Fibonacci Retracement for Crypto Price Predictions
Let’s take an example of a recent Bitcoin price chart. A significant upward trend is observed, followed by a correction. The swing from the high to the low of this correction phase is used to calculate the Fibonacci retracement levels. The resulting levels can indicate potential support areas where the price might find buyers.
Example: Ethereum Price Analysis
Similar to Bitcoin, consider an Ethereum chart. An initial upward trend, followed by a substantial price drop, can be analyzed. By calculating Fibonacci retracement levels from this drop, potential support zones can be identified, where the price might find buyers and reverse its downtrend. If the price breaks below a significant Fibonacci level, it may indicate further bearish momentum.
Table: Effectiveness Across Cryptocurrencies
This table summarizes the effectiveness of Fibonacci retracement across different cryptocurrencies, highlighting varying price patterns.
| Cryptocurrency | Price Pattern | Effectiveness of Fibonacci Retracement |
|---|---|---|
| Bitcoin | Significant bull and bear cycles | High effectiveness in identifying potential support and resistance levels |
| Ethereum | Volatile price action, but with recognizable trends | Moderate effectiveness, useful for identifying potential reversal points |
| Dogecoin | Highly speculative, with unpredictable patterns | Lower effectiveness due to the inherent volatility and lack of established trends |
Note: The effectiveness of Fibonacci retracement can vary depending on the cryptocurrency’s specific price action and the chosen timeframe for analysis. The table above provides a general overview.
Understanding Price Action and Trends

Source: goodcrypto.app
Before diving into Fibonacci retracement, a crucial step is understanding price action and market trends. This knowledge provides context and helps interpret the significance of Fibonacci levels within the broader market movement. Ignoring underlying trends can lead to misinterpretations and potentially poor trading decisions. Understanding the current trend allows traders to identify areas of potential support and resistance with greater accuracy.
Importance of Identifying Trends
Price trends are fundamental to technical analysis. They represent the overall direction of a market’s movement over a defined period. A strong understanding of trends allows traders to anticipate potential price movements and place trades accordingly. Recognizing whether a market is trending up, down, or sideways is crucial for successful trading strategies. Incorrectly identifying a trend can lead to significant losses.
Identifying Bullish and Bearish Trends
Bullish trends are characterized by a general upward movement in price. This is often accompanied by increasing volume and rising highs and lows. Visual cues on a price chart include a series of higher highs and higher lows. Bearish trends, conversely, display a general downward movement in price, often with decreasing volume and falling lows and highs.
On a chart, this is reflected by a sequence of lower lows and lower highs. Sideways trends are flat, with neither a clear upward nor downward movement, where price oscillates within a defined range.
Fibonacci Retracement in Different Trend Types
Fibonacci retracement works effectively across all trend types. In an uptrend, Fibonacci retracement levels may highlight potential support areas where the price might pause or reverse. In a downtrend, these levels can suggest resistance areas where the price might find temporary support before continuing its downward path. In sideways trends, Fibonacci levels can act as areas of consolidation or potential breakouts, providing insights into possible turning points.
The key is to combine Fibonacci retracement with the broader trend analysis for a more comprehensive understanding.
Using Additional Technical Indicators
Combining Fibonacci retracement with other technical indicators, such as moving averages, volume indicators, or oscillators, enhances trading accuracy. Moving averages provide insights into the overall direction of the trend. Volume indicators show the strength of the price movements, indicating whether the current price action is supported by significant buying or selling pressure. Oscillators, like RSI (Relative Strength Index), provide insights into momentum, potentially highlighting overbought or oversold conditions.
Potential Pitfalls of Sole Reliance on Fibonacci Retracement
While Fibonacci retracement can be a valuable tool, relying solely on it for price predictions has inherent limitations.
- Fibonacci retracement levels are not guarantees of price action. They represent potential support or resistance levels, but prices are not obligated to adhere to them.
- It’s essential to consider other market factors, such as news events, economic data releases, or broader market sentiment, alongside technical analysis.
- Over-reliance on a single indicator can lead to missed opportunities or incorrect predictions. A holistic approach integrating various indicators and market analysis is more reliable.
- Fibonacci retracement, in isolation, is not a predictor of future prices. It is a tool to identify potential support and resistance levels that should be considered within a broader market context.
- Market conditions and sentiment can alter the validity of Fibonacci retracement levels. Periods of extreme volatility may render Fibonacci levels less effective in anticipating price movements.
Analyzing Price Movements Using Fibonacci Retracement
Fibonacci retracement, a powerful tool in technical analysis, helps identify potential support and resistance levels in crypto markets. By analyzing historical price movements and applying Fibonacci ratios, traders can anticipate potential price reversals and optimize entry and exit points. This technique is particularly useful for spotting areas where the price might pause or reverse its trend, allowing traders to make more informed decisions.Applying Fibonacci retracement to price charts involves identifying significant price swings and then calculating Fibonacci levels within that range.
These levels are not guarantees of price action, but they highlight areas where price has historically found support or resistance. Understanding these levels, combined with other technical indicators, can enhance the accuracy of trading decisions.
Identifying Potential Entry and Exit Points
Fibonacci retracement levels offer potential entry and exit points by indicating areas where the price might consolidate or reverse. Traders can look for opportunities to enter positions when the price approaches a Fibonacci retracement level, anticipating a potential upward or downward movement. Conversely, existing positions can be exited near these levels when price action signals a reversal. It’s important to note that these are not guarantees; price action should always be considered in conjunction with other indicators.
Identifying Potential Reversal Points
Fibonacci levels can signal potential reversal points. When the price approaches a Fibonacci level and shows signs of weakness, such as a bearish candlestick pattern or a decrease in volume, it suggests a potential reversal in trend. Conversely, a bullish candlestick pattern or increased volume near a Fibonacci level could signal a continuation of the upward trend. Recognizing these subtle patterns can help traders capitalize on potential reversal points.
Strategies for Utilizing Fibonacci Retracement
Various strategies utilize Fibonacci retracement in crypto trading. A common strategy involves entering long positions when the price approaches a Fibonacci retracement level that coincides with a bullish trend. Another strategy is to exit short positions when the price hits a Fibonacci retracement level that corresponds with a bearish trend.
Comparing and Contrasting Trading Strategies
Different strategies using Fibonacci retracement can be compared and contrasted based on their risk tolerance and potential profitability. A conservative strategy might focus on entering positions only when the price action aligns with the Fibonacci level and other supportive indicators. A more aggressive strategy might utilize Fibonacci levels as a primary signal but incorporate additional indicators like moving averages or volume analysis.
Table: Potential Entry and Exit Points
| Fibonacci Level | Price Action | Potential Entry Point | Potential Exit Point |
|---|---|---|---|
| 0.382 | Price consolidating, volume decreasing, bearish candlestick pattern | Potential short entry | Potential exit for existing long position |
| 0.618 | Price consolidating, bullish candlestick pattern, increasing volume | Potential long entry | Potential exit for existing short position |
| 0.786 | Price approaching, high volume | Potential long entry/exit based on existing trend | Potential exit for existing short position/entry for short position |
Note: This table is a simplified example. Thorough analysis of price action and other technical indicators is crucial for successful trading. The specific entry and exit points will vary depending on the individual trading strategy and the specific market conditions.
Practical Application in Crypto Trading
Applying Fibonacci retracement to crypto trading involves integrating its principles into a comprehensive trading strategy. This involves more than just identifying potential support and resistance levels; it requires understanding the broader market context and incorporating risk management techniques. Successful implementation hinges on recognizing market trends, adjusting strategies to changing conditions, and meticulously managing capital.Successfully integrating Fibonacci retracement into a trading plan requires a nuanced approach.
It’s not a standalone solution but rather a tool to enhance existing strategies, adding a layer of technical analysis to informed decision-making. This approach enables traders to identify potential entry and exit points, enhancing the probability of profitable trades within the crypto market’s dynamic environment.
Integrating Fibonacci Retracement into a Trading Plan
A well-defined trading plan incorporates Fibonacci retracement by using it to pinpoint potential support and resistance levels. This is then combined with other technical indicators, such as moving averages or volume analysis, to confirm the validity of these levels. The plan should clearly Artikel the specific cryptocurrencies targeted, the expected price movements, and the defined risk tolerance. This structured approach enhances the effectiveness of Fibonacci retracement as a tool in a broader trading strategy.
Examples of Successful Applications
The successful application of Fibonacci retracement in crypto trading is exemplified by the analysis of the Bitcoin price during the 2021 bull run. Fibonacci retracement levels were used to identify potential support levels, which were subsequently validated by the market’s reaction. Traders using this analysis often saw opportunities to enter long positions at these support levels. Other successful applications include identifying potential entry and exit points for altcoins with strong upward momentum, or when anticipating a significant correction in a rising market.
These real-world examples highlight the utility of Fibonacci retracement in identifying potential trading opportunities.
Adjusting Strategies Based on Different Market Conditions
Market conditions significantly influence the effectiveness of Fibonacci retracement. In a bullish trend, retracement levels may serve as support, while in a bearish trend, they might act as resistance. Adapting the strategy to the prevailing market condition is crucial. A trader observing a highly volatile market might use Fibonacci retracement in conjunction with higher timeframes to identify broader trends, while in a stable market, shorter timeframes could be used to capture smaller price movements.
The strategy should be flexible and responsive to market fluctuations.
Risk Management and Capital Management
Effective risk management is paramount when employing Fibonacci retracement. Set stop-loss orders at levels that safeguard capital against potential losses. A defined risk tolerance should be established, and position sizing should be adjusted based on the level of risk associated with the identified trade. Avoid over-leveraging and ensure capital is allocated strategically to manage potential losses effectively.
The goal is to limit potential losses while maximizing potential gains.
Step-by-Step Guide for Combining Fibonacci Retracement and Other Indicators
A comprehensive trading strategy using Fibonacci retracement and other indicators involves a multi-step process:
- Identify the prevailing market trend (bullish or bearish) using relevant indicators, such as moving averages and volume.
- Determine potential support and resistance levels using Fibonacci retracement levels.
- Confirm these levels with other indicators, like volume analysis, to enhance accuracy.
- Establish a clear risk management plan, including stop-loss orders and position sizing.
- Enter a trade based on the identified levels and market conditions.
- Monitor the trade closely and adjust the strategy if necessary based on market movements.
Limitations and Considerations
Fibonacci retracement, while a valuable tool, isn’t a crystal ball for predicting crypto prices. Its effectiveness is contingent on various factors, and relying solely on this technique can lead to significant risks. Understanding these limitations is crucial for responsible crypto trading.While Fibonacci retracement can highlight potential support and resistance levels, it doesn’t guarantee price action will adhere to those levels.
It’s a tool for identifying patterns, not for absolute certainty. Overlooking other critical factors can lead to costly mistakes.
Potential Drawbacks of Using Fibonacci Retracement
Fibonacci retracement, like any technical analysis tool, has inherent limitations. It doesn’t account for unforeseen market events, changes in investor sentiment, or regulatory interventions. Over-reliance on this tool can lead to missed opportunities or poor trading decisions. The tool itself is only as good as the data it’s applied to, and inaccurate or incomplete data will yield misleading results.
Importance of Risk Management and Diversification
Risk management is paramount in crypto trading. Never risk more capital than you can afford to lose. Diversification is equally crucial. Don’t put all your eggs in one basket; spread your investments across different cryptocurrencies and asset classes. This strategy mitigates potential losses if a specific investment performs poorly.
Figuring out crypto price predictions using Fibonacci Retracement can be a tricky task, but it’s definitely doable. Understanding support and resistance levels is key, and sometimes, you need a little extra help, like a soothing natural remedy. For example, if you’re feeling nauseous during your crypto trading sessions, consider incorporating ginger into your routine. Research shows that ginger can help with nausea and a healthy stomach, as detailed in this insightful article How Ginger Helps Relieve Nausea and Promotes a Healthy Stomach.
Ultimately, a calm and clear mind is crucial when applying Fibonacci Retracement, so keeping your stomach happy can contribute to your crypto strategy.
A well-defined risk management strategy can help protect your capital and prevent significant losses in the face of adverse market conditions.
Understanding Fibonacci Retracement is crucial for crypto price predictions, but spotting the next big 100x coin is a whole different ballgame. Learning how to identify potential breakout points is key, and for that, you need to delve into strategies beyond basic retracement patterns. Check out this insightful article on How to Find the Next 100x Crypto Before It Goes Mainstream for a deeper dive into potential project selection.
Ultimately, Fibonacci Retracement provides a framework for understanding price fluctuations, which is just one piece of the puzzle when evaluating potential investment opportunities.
Market Conditions Affecting Fibonacci Retracement Effectiveness
Certain market conditions can render Fibonacci retracement less effective. For instance, periods of extreme volatility or sudden, unexpected news events can disrupt established patterns. In highly speculative markets, price action can deviate significantly from anticipated levels. A market dominated by sudden price fluctuations or news-driven events may make Fibonacci retracement less reliable.
Considering Other Factors in Trading Decisions
While Fibonacci retracement can reveal potential support and resistance levels, it shouldn’t be the sole determinant of trading decisions. Consider news events, market sentiment, and overall economic conditions. For example, a significant regulatory change impacting a specific cryptocurrency could drastically alter its price trajectory, overriding any predicted Fibonacci retracement levels. News events and market sentiment should be carefully evaluated before making any trading decisions.
Common Pitfalls and Mitigation Strategies
| Pitfall | Mitigation Strategy |
|---|---|
| Over-reliance on Fibonacci retracement as the sole trading signal. | Integrate Fibonacci retracement with other technical indicators and fundamental analysis. Consider market sentiment and news events. |
| Ignoring other relevant factors (e.g., news, sentiment, and fundamental analysis). | Combine Fibonacci retracement with broader market analysis and fundamental data. |
| Applying Fibonacci retracement to insufficient or inaccurate data. | Ensure the data used for analysis is reliable and comprehensive. Utilize reputable sources and validate the data’s accuracy. |
| Assuming price action will precisely follow Fibonacci levels. | Treat Fibonacci retracement levels as potential support or resistance zones, not guarantees. Factor in market volatility and unexpected events. |
| Failing to adjust trading strategy based on changing market conditions. | Continuously monitor market trends and adjust your trading strategy as needed. Flexibility and adaptability are crucial. |
Last Word
Source: googleusercontent.com
In conclusion, understanding and applying Fibonacci retracement can be a valuable tool for crypto traders seeking to navigate the complexities of the market. While not a foolproof method, when combined with other technical indicators and a solid risk management strategy, it can enhance your ability to identify potential price movements. Remember, however, that market conditions and individual circumstances will always affect the effectiveness of any trading strategy.
Always conduct thorough research and practice caution before making any investment decisions.
Questions and Answers
What are the common pitfalls of relying solely on Fibonacci retracement?
Fibonacci retracement is a helpful tool, but it’s not a crystal ball. Market sentiment, news events, and unforeseen circumstances can all impact price action, rendering Fibonacci levels less reliable. Always consider other factors and develop a comprehensive trading strategy that includes risk management.
How do I choose the appropriate price swings for calculating retracement levels?
The key is to select significant price swings. Consider recent highs and lows or periods of significant price volatility. Don’t just pick arbitrary swings; choose those that have a history of meaningful price action. Look for established support and resistance levels.
How can I integrate Fibonacci retracement into a broader trading plan?
Start by identifying potential support and resistance levels. Then, establish your entry and exit points based on these levels and your chosen trading strategy. Factor in risk management by setting stop-loss orders and profit targets. Continuously monitor and adapt your strategy based on market conditions.
Can Fibonacci retracement be used for short-term trading?
While Fibonacci retracement can be applied across various timeframes, its effectiveness might vary. For short-term trading, its use might be less reliable as smaller timeframes often exhibit higher volatility, making short-term predictions more challenging. In such instances, incorporating additional short-term indicators can improve accuracy.