Mastering Crypto Trading with MACD and RSI
How to Use MACD and RSI Indicators for Better Crypto Trading reveals the secrets to unlocking profitable crypto trades. Dive into the world of technical analysis with these powerful indicators, learning how to interpret signals and combine them for smarter decisions.
This guide will explore the intricacies of MACD (Moving Average Convergence Divergence) and RSI (Relative Strength Index), from their fundamental principles to advanced strategies. We’ll dissect their individual strengths and weaknesses, examining how they work in the volatile crypto market. Furthermore, you’ll discover how to combine them for a more comprehensive approach, ultimately maximizing your potential for success.
Introduction to MACD and RSI
Understanding market trends is crucial for successful crypto trading. Two popular technical indicators, MACD (Moving Average Convergence Divergence) and RSI (Relative Strength Index), offer valuable insights into potential price movements. They help traders identify potential buying and selling opportunities, but they should be used as part of a comprehensive trading strategy, not as the sole determinant of decisions.These indicators analyze price and volume data to provide signals about the strength and momentum of a cryptocurrency’s price trend.
By understanding how these indicators work and how to interpret their signals, traders can potentially improve their decision-making process and potentially increase their chances of profit.
MACD (Moving Average Convergence Divergence)
MACD is a trend-following momentum indicator that identifies changes in the strength of a trend. It compares two moving averages of a security’s price to determine the momentum. The MACD line itself is the difference between a short-term and a long-term exponential moving average (EMA). A signal line is a 9-day EMA of the MACD line, used to smooth out the signals from the MACD line.
Mastering technical indicators like MACD and RSI is crucial for successful crypto trading. Understanding how these indicators react to market fluctuations is key. This knowledge becomes even more valuable when you consider why institutional investors are pouring capital into crypto, as detailed in this insightful piece on Why Institutional Investors Are Betting Big on Cryptocurrency. By analyzing how these large players are behaving, traders can glean valuable insights that can be used to interpret price movements.
Ultimately, a solid understanding of MACD and RSI signals, combined with an awareness of institutional trends, is the recipe for more informed and potentially more lucrative crypto trading decisions.
The core principle of MACD is that when the MACD line crosses above the signal line, it suggests a bullish trend, while a cross below signals a bearish trend. Divergence between price and MACD can also indicate potential reversals.
MACD is used in crypto trading to identify potential buy or sell signals based on the relationship between the MACD line and the signal line. For instance, a bullish crossover (MACD line crossing above the signal line) might suggest a potential uptrend, prompting traders to consider a long position. Conversely, a bearish crossover might suggest a downtrend, prompting traders to consider a short position.
RSI (Relative Strength Index)
RSI is a momentum indicator that measures the magnitude of recent price changes to evaluate overbought or oversold conditions. It’s calculated using the average gains and losses over a specific period.
Knowing how to use MACD and RSI indicators can definitely boost your crypto trading game, but it’s crucial to remember that market volatility is a constant factor. Understanding best practices for protecting your crypto assets, like diversifying your portfolio and setting stop-loss orders, is just as important as mastering technical indicators. Check out these solid strategies for safeguarding your investments Best Practices to Protect Your Crypto Assets During Market Volatility to ensure you’re not just looking at charts but also at the bigger picture of risk management.
Ultimately, combining a deep understanding of indicators with proactive risk management is key to successful crypto trading.
A typical RSI value ranges from 0 to 100. Values above 70 often suggest an asset is overbought, potentially indicating a potential price reversal or correction. Conversely, values below 30 often suggest an asset is oversold, potentially indicating a potential price rebound.
In crypto trading, RSI is used to identify overbought and oversold conditions. For example, if the RSI of a cryptocurrency is consistently above 70, it might suggest the asset is overvalued and could be due for a correction. Conversely, if the RSI is consistently below 30, it might suggest the asset is undervalued and could be due for a rebound.
Comparing MACD and RSI
| Feature | MACD | RSI |
|---|---|---|
| Type | Momentum | Momentum |
| Focus | Trend strength and changes | Overbought/oversold conditions |
| Calculation | Difference between two EMAs | Ratio of average gains to average losses |
| Interpretation | Crossovers signal potential trend changes | Values above 70/below 30 suggest overbought/oversold |
| Use in Crypto Trading | Identifying potential trend reversals | Identifying potential price corrections or rebounds |
These indicators are powerful tools for analyzing crypto market trends, but they should be used in conjunction with other indicators and fundamental analysis for a more comprehensive understanding.
Understanding MACD Signals
MACD, or Moving Average Convergence Divergence, is a popular technical indicator used in crypto trading to identify potential trend changes and trading opportunities. Understanding the nuances of MACD signals is crucial for making informed trading decisions. This section delves into the various MACD signal patterns, how to interpret crossovers, and the significance of divergence for crypto traders.
MACD Signal Patterns
MACD signals are visually represented by the MACD line and the signal line. These lines oscillate above and below the zero line, indicating bullish or bearish momentum. Understanding these patterns is key to recognizing potential turning points in the market.
- Bullish Signals: A bullish signal occurs when the MACD line crosses above the signal line. This suggests that the bullish momentum is strengthening. A common example is when the MACD line rises above the zero line and the signal line, signaling an upward trend.
- Bearish Signals: A bearish signal is indicated when the MACD line crosses below the signal line. This points to a weakening of the bullish trend and the potential for a downtrend. A bearish signal might occur when the MACD line falls below the zero line and the signal line, signifying a possible reversal.
- Neutral Signals: Neutral signals occur when the MACD line and signal line remain relatively stable, either near the zero line or moving in tandem. This implies that the market is consolidating or indecisive.
Interpreting MACD Crossover Signals
MACD crossover signals, where the MACD line crosses above or below the signal line, are often interpreted as buy or sell signals. The strength and duration of the crossover are crucial considerations. For instance, a swift and decisive crossover often signals a more significant price movement.
Mastering MACD and RSI indicators is crucial for savvy crypto traders. Understanding how these technical tools can pinpoint potential buy or sell signals is key. However, the increasing global adoption of cryptocurrencies as legal tender, like in some countries exploring the space, as detailed in this insightful article ( Why More Countries Are Adopting Cryptocurrency as Legal Tender ), highlights the evolving nature of the market.
Ultimately, integrating these indicators into your trading strategy remains essential for navigating the complexities of this dynamic asset class.
- Buy Signal (Bullish Crossover): When the MACD line crosses above the signal line, it often suggests an upward trend. Traders might consider entering a long position, buying the asset, or increasing their holdings.
- Sell Signal (Bearish Crossover): A bearish crossover, where the MACD line falls below the signal line, often indicates a weakening trend. Traders might consider exiting a long position, selling the asset, or reducing their holdings.
Using the MACD Histogram
The MACD histogram visually represents the difference between the MACD line and the signal line. A larger histogram bar indicates a greater difference, potentially signifying a stronger trend. The height and direction of the histogram bars provide additional information about the strength of the trend.
- Strong Signals: A histogram with significant bars, either above or below zero, often suggests a strong trend and potentially greater price movements.
- Weak Signals: A histogram with smaller bars, especially when close to zero, often indicates a weaker trend and less significant price movement.
MACD Divergence
MACD divergence occurs when the price action moves in the opposite direction of the MACD line. This can be a significant signal of a potential trend reversal. For instance, a bearish divergence might signal a potential reversal from a bullish trend.
- Bullish Divergence: This occurs when the price makes a lower low, but the MACD line makes a higher low. This might suggest a potential bullish reversal.
- Bearish Divergence: This happens when the price makes a higher high, but the MACD line makes a lower high. This often signals a potential bearish reversal.
MACD Crossover Scenarios in Crypto Trading, How to Use MACD and RSI Indicators for Better Crypto Trading
The following table illustrates different MACD crossover scenarios in crypto trading, providing examples of potential outcomes.
| Scenario | MACD Line Action | Signal Line Action | Potential Trading Decision | Example |
|---|---|---|---|---|
| Bullish Crossover | Crosses above the signal line | Buy | Bitcoin price showing an uptrend | |
| Bearish Crossover | Crosses below the signal line | Sell | Ethereum price showing a downtrend | |
| Bullish Divergence | Higher low | Lower low | Potential Buy | XRP price and MACD divergence signals |
| Bearish Divergence | Lower high | Higher high | Potential Sell | Solana price and MACD divergence signals |
Understanding RSI Signals
The Relative Strength Index (RSI) is a momentum oscillator that measures the magnitude of recent price changes to evaluate overbought and oversold conditions in the market. It helps traders identify potential trend reversals and assess the strength of a prevailing trend. By understanding RSI signals, traders can make more informed decisions about entry and exit points in their crypto trading strategies.
RSI Overbought and Oversold Levels
The RSI oscillates between 0 and 100. Commonly recognized overbought levels are typically above 70, indicating an asset’s price might have risen too quickly and could be due for a correction. Conversely, oversold levels are generally below 30, suggesting a potential price rebound due to excessive selling pressure. These levels are not absolute; market conditions and asset-specific characteristics can influence these thresholds.
Individual traders may adjust these thresholds based on their experience and risk tolerance.
Identifying Bullish and Bearish RSI Signals
Bullish RSI signals occur when the RSI line rises above the oversold zone (typically below 30) and continues to move upwards. This suggests a potential upward trend reversal. Bearish signals are triggered when the RSI line falls below the overbought zone (typically above 70) and continues to decline, signaling a potential downward trend reversal. Careful observation of price action alongside RSI signals is crucial for confirmation.
Significance of RSI Divergence
RSI divergence occurs when the price makes a new high or low, but the RSI fails to make a corresponding high or low. This divergence can signal a potential trend reversal. For example, if the price makes a new high, but the RSI fails to make a new high, it might indicate a weakening bullish trend. Conversely, if the price makes a new low, but the RSI fails to make a new low, it might indicate a strengthening bearish trend.
The strength of the divergence, combined with other technical indicators, can help traders gauge the potential magnitude of the price movement.
Using RSI Readings for Entry and Exit Points
Traders can use RSI readings to identify potential entry and exit points. For instance, when the RSI falls below 30, it could signal an entry point for a potential bullish trend. A trader might wait for confirmation from price action, like a bounce from a support level, to enter a long position. Similarly, when the RSI rises above 70, it could suggest an exit point from a long position, anticipating a potential price correction.
These are just examples, and traders must consider other technical and fundamental factors.
RSI Trading Implications Table
| RSI Reading | Trading Implications |
|---|---|
| Below 30 | Potential bullish reversal, possible entry point (after price action confirmation) |
| 30-50 | Neutral zone, requires further analysis and confirmation from other indicators |
| 50-70 | Neutral zone, requires further analysis and confirmation from other indicators |
| Above 70 | Potential bearish reversal, possible exit point (after price action confirmation) |
Combining MACD and RSI for Enhanced Trading

Source: hedgewithcrypto.com
Combining the MACD and RSI indicators can significantly enhance your crypto trading decisions by providing a more comprehensive picture of market momentum and potential reversals. By analyzing the interplay between these indicators, you can identify more nuanced trading opportunities and potentially reduce the risk of false signals. This approach requires understanding how the signals from both indicators interact and how to interpret their combined outputs.The combined analysis of MACD and RSI provides a more holistic perspective than relying on either indicator alone.
While MACD primarily focuses on momentum, RSI gauges the strength of that momentum. By correlating these insights, traders can potentially identify higher-probability trading opportunities. This synergistic approach can reveal subtle shifts in market sentiment and trends that might be missed using a single indicator.
MACD Crossover Confirming RSI Divergence
A powerful strategy involves looking for MACD crossovers that align with RSI divergence. Divergence occurs when the price makes a new high or low, but the RSI fails to do so in the same direction. A bullish divergence, for example, occurs when the price makes a new high, but the RSI makes a lower high. If a bullish MACD crossover happens during a bullish RSI divergence, it strengthens the likelihood of a price increase.
Conversely, a bearish divergence coupled with a bearish MACD crossover could signal a potential downtrend. This combination provides a more robust confirmation of the price movement’s direction.
Interpreting Combined Signals
Interpreting combined signals from MACD and RSI requires careful attention to the specific patterns and the context of the market. A bullish MACD crossover accompanied by a bullish RSI divergence is a stronger signal than a bullish MACD crossover alone. Conversely, a bearish MACD crossover accompanied by a bearish RSI divergence further reinforces the potential for a price decline.
However, it’s crucial to remember that these are not foolproof indicators; market conditions can influence the effectiveness of these signals. Therefore, traders should always use a combination of technical and fundamental analysis before making any trading decisions.
Strengths and Weaknesses of Combining Indicators
Combining MACD and RSI offers several advantages. It enhances the signal strength, potentially reducing the risk of false signals. The combined signals provide a more comprehensive understanding of market momentum and potential reversals. However, relying solely on these indicators can be problematic. The indicators are not always reliable, and market conditions can influence their effectiveness.
Over-reliance on technical indicators can lead to missed opportunities or incorrect decisions. Fundamental analysis should always complement technical analysis for a more balanced approach.
Strategies for Combining MACD and RSI
| Strategy | Description | Interpretation |
|---|---|---|
| MACD Crossover with RSI Divergence | A bullish MACD crossover coinciding with a bullish RSI divergence suggests a potential upward trend. | Strong bullish signal. |
| MACD Crossover with RSI Overbought/Oversold | A bearish MACD crossover occurring when RSI is overbought signals potential downtrend. | Confirmation of a potential reversal. |
| MACD and RSI Moving Averages | Combining MACD and RSI with moving averages can help identify trends and potential support/resistance levels. | Trend confirmation and potential reversal points. |
Each strategy provides a different perspective on the market. Careful consideration of the interplay between these indicators can lead to more informed and potentially profitable trading decisions.
Practical Application and Examples
Putting theory into practice is crucial for successful crypto trading. This section dives into real-world examples of how to use MACD and RSI together, highlighting successful trades and the vital role of risk management. We’ll also demonstrate how to adapt these strategies for various cryptocurrencies, offering a detailed, actionable trading strategy template.Successfully integrating MACD and RSI requires a deep understanding of their individual signals and how they interact.
Analyzing historical price action and market sentiment through these indicators can help predict potential trends and identify profitable entry and exit points. This practical application allows for more informed decisions and reduced reliance on pure speculation.
MACD and RSI Usage in Crypto Trading
MACD and RSI provide crucial insights into market momentum and potential reversals. When used in tandem, they offer a more comprehensive picture than using either indicator alone. By identifying converging and diverging patterns, traders can anticipate price movements with greater accuracy. For instance, a bullish crossover in MACD, accompanied by a rising RSI above 50, suggests a strong upward trend.
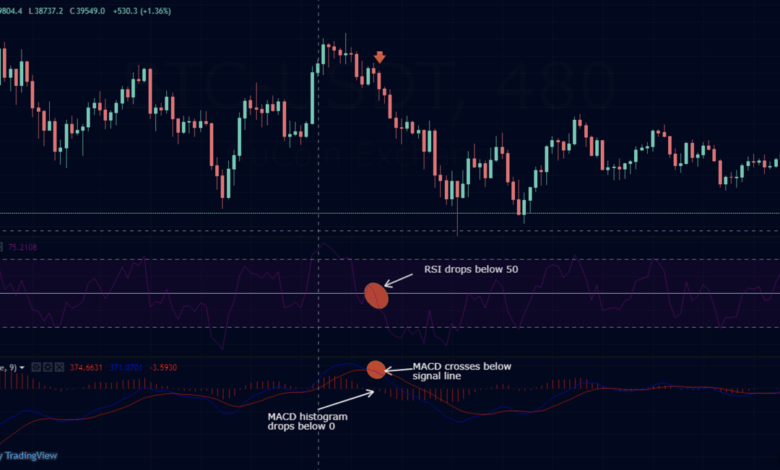
Conversely, a bearish crossover in MACD coupled with a declining RSI below 30 might signal a potential downward trend.
Examples of Successful Trades Using a Combination
A successful trade often involves recognizing the confluence of signals from both indicators. Consider Bitcoin. If MACD shows a bullish crossover above the zero line and RSI is rising above 50, it suggests a potential upward move. This confluence strengthens the signal and allows for a more confident entry point. A similar bearish scenario would involve a bearish crossover and RSI falling below 30, signaling a potential downward move.
Significance of Risk Management
Risk management is paramount in crypto trading. No indicator can guarantee profits. Setting stop-loss orders and defining maximum position sizes is crucial to limit potential losses. A significant drop in price, regardless of the signals, could lead to substantial losses. Therefore, a well-defined risk management plan is essential to protect capital and maintain trading discipline.
Adapting Strategies to Different Cryptocurrencies
Cryptocurrencies have diverse price behaviors. Strategies must be adapted based on the specific cryptocurrency’s characteristics. For example, altcoins often exhibit more volatile price swings, requiring more cautious application of MACD and RSI. Thorough analysis of the specific cryptocurrency’s historical price action and trading volume is necessary before applying any strategy.
Detailed Example of a Crypto Trading Strategy
This example uses Bitcoin (BTC) data for demonstration purposes. The strategy involves entering a long position when MACD crosses above the zero line and RSI is above 50, and exiting when MACD crosses below the zero line or RSI drops below 30.
| Date | Price (USD) | MACD | RSI | Action |
|---|---|---|---|---|
| 2024-07-26 | 30,000 | -1.5 | 45 | No Action |
| 2024-07-27 | 30,500 | 0.5 | 52 | Buy (Long Position) |
| 2024-07-28 | 31,000 | 2.0 | 60 | Hold |
| 2024-07-29 | 30,800 | 1.0 | 55 | Hold |
| 2024-07-30 | 30,200 | -0.5 | 48 | Sell (Close Position) |
This is a simplified example. Real-world trading strategies would incorporate more sophisticated risk management techniques and potentially different parameters for MACD and RSI.
Limitations and Considerations
While MACD and RSI indicators can provide valuable insights into cryptocurrency market trends, they are not foolproof predictors of future price movements. Relying solely on these indicators can lead to significant losses if not used judiciously and in conjunction with other analysis techniques. It’s crucial to understand their limitations and integrate them into a broader trading strategy that incorporates other market factors.Over-reliance on any single technical indicator, including MACD and RSI, is a common pitfall in trading.
A holistic approach that considers market sentiment, news events, and broader economic trends is essential for making informed decisions. The crypto market is notoriously volatile, and relying solely on technical indicators can leave traders vulnerable to unexpected price swings.
Potential Limitations of MACD and RSI
MACD and RSI, while helpful, are lagging indicators. They reflect past price action, not future price movements. This inherent delay can make it difficult to capitalize on short-term price changes. Moreover, these indicators are not predictive on their own. They should be seen as tools to identify potential trends or support/resistance levels, not definitive signals to buy or sell.
Importance of Market Sentiment and Other Factors
Cryptocurrency trading is influenced by a multitude of factors beyond technical indicators. News events, regulatory changes, and shifts in investor sentiment can all significantly impact price movements. Analyzing market sentiment through social media analysis, news articles, and forums can complement technical analysis, providing a more comprehensive view of the market.
Importance of Understanding the Context of the Cryptocurrency Market
Different cryptocurrencies have varying market dynamics. Understanding the specific characteristics of a particular cryptocurrency, including its use case, development team, and community, is crucial. A trading strategy effective for one cryptocurrency might not be applicable to another. Contextual awareness is essential for applying MACD and RSI effectively.
Pitfalls of Over-reliance on Indicators
Over-reliance on MACD and RSI can lead to trading errors. These indicators can generate false signals, especially during periods of market consolidation or volatility. A trader focused solely on these indicators might miss important market shifts or opportunities. The focus should always be on the underlying fundamentals and broader market context, not just on the technical indicators.
Mitigation Strategies for Limitations
A comprehensive trading strategy should incorporate various factors beyond MACD and RSI. By considering market sentiment, news events, and other relevant factors, traders can mitigate the risks associated with relying solely on technical indicators. A strong understanding of the cryptocurrency market, including its fundamentals and specific characteristics, is also critical.
| Common Limitations | Mitigation Strategies |
|---|---|
| Lagging indicators | Combine with fundamental analysis and other market factors |
| False signals | Utilize multiple indicators and confirm signals with other data points |
| Limited predictive power | Avoid over-reliance; incorporate broader market analysis and sentiment |
| Varying market dynamics across cryptocurrencies | Understand the specific characteristics of each cryptocurrency |
Advanced Strategies and Techniques

Source: staticimg.com
Taking MACD and RSI beyond the basics opens up a world of more sophisticated trading strategies. This section dives into advanced techniques for interpreting signals, adapting to market volatility, and combining these indicators with other tools to refine your crypto trading approach. We’ll explore how to use multiple timeframes, and how to tailor your strategy to changing market conditions.
Multiple Timeframe Analysis
Analyzing MACD and RSI across different timeframes provides a more comprehensive picture of market trends. This approach helps identify potential entry and exit points, confirming signals from shorter-term charts with longer-term ones. For instance, a strong buy signal on a 4-hour chart could be reinforced by a bullish trend on a daily chart, increasing the probability of a successful trade.
Conversely, a bearish signal on a 1-hour chart might be invalidated by an upward trend on a daily chart.
Adapting to Changing Market Conditions
Crypto markets are notoriously volatile. Adapting your strategy in response to shifting conditions is crucial for success. This means being flexible in interpreting signals and adjusting your entry/exit points in response to changing market sentiment and volume. For example, during periods of high volatility, using wider stop-loss orders can help manage risk, while during periods of low volatility, tighter stop-loss orders might be appropriate.
Combining with Other Indicators
MACD and RSI aren’t standalone tools; they can be highly effective when combined with other technical indicators. This combined analysis can improve the accuracy of signals and reduce the risk of false positives. For instance, combining MACD and RSI with volume data can help identify the strength of a trend. A strong bullish trend with increasing volume on the MACD and RSI could signal a more significant upward move than one without increased volume.
Similarly, a bearish trend with declining volume would suggest a potentially less significant downturn. A Volume Weighted Average Price (VWAP) indicator could be combined with MACD and RSI to provide insight into the price movement’s impact on the overall market.
Advanced Strategies Table
| Strategy | MACD Signal | RSI Signal | Additional Considerations | Example |
|---|---|---|---|---|
| Trend Confirmation | Bullish crossover or sustained upward trend | RSI above 70, but moving lower | Look for confirmation from volume and other indicators. | A bullish crossover on the MACD with RSI moving from overbought territory could indicate a temporary pullback before a continuation of the upward trend. |
| Divergence Trading | MACD line making lower highs while price makes higher highs | RSI making lower lows while price makes higher lows | Requires a strong understanding of market context and confirming signals from other indicators. | This divergence pattern can suggest an impending price reversal. |
| Breakout Strategy | MACD signals a breakout above a significant resistance level | RSI above 50 with an upward trend | High risk; confirmation from other indicators and strong volume is needed. | A breakout from a consolidation phase with MACD confirming the trend and RSI moving upwards could suggest a continuation of the uptrend. |
Conclusive Thoughts
In conclusion, mastering MACD and RSI is a crucial step in navigating the complexities of crypto trading. By understanding their individual signals, combined strategies, and inherent limitations, you can make more informed decisions and increase your chances of success. Remember, consistent learning and adaptation are key to staying ahead in this ever-evolving market.
Quick FAQs: How To Use MACD And RSI Indicators For Better Crypto Trading
What are some common pitfalls when relying solely on MACD and RSI?
Over-reliance on these indicators can lead to missing crucial market shifts and ignoring fundamental factors. It’s vital to combine them with other analyses and remain adaptable to market fluctuations.
How do I adjust these strategies for different cryptocurrencies?
The volatility and characteristics of each cryptocurrency vary. Adapting your strategy involves examining the specific historical data and market trends for each coin.
What is the role of market sentiment in using MACD and RSI?
Market sentiment is crucial. While MACD and RSI provide technical insights, understanding the overall mood of the market (e.g., fear, greed) complements your technical analysis.
How can I integrate MACD and RSI with other technical indicators?
Combining MACD and RSI with other indicators like moving averages, volume analysis, or support/resistance levels provides a more comprehensive understanding of market trends, potentially enhancing trading accuracy.