How to Spot Crypto Breakout Patterns for Maximum Gains
How to Spot Crypto Breakout Patterns for Maximum Gains dives deep into the world of crypto trading, revealing the secrets to identifying breakout patterns. Unlocking these patterns is key to capitalizing on market shifts and maximizing your potential gains. We’ll explore everything from basic chart analysis to advanced strategies, equipping you with the knowledge and tools to spot these crucial market movements.
This isn’t just about theory; we’ll get practical with real-world examples and actionable insights.
From understanding chart types and volume analysis to mastering support and resistance levels, we’ll provide a comprehensive guide to crypto breakout patterns. Learn to evaluate risk and reward, manage your positions effectively, and backtest your strategies for optimal results. This detailed approach will empower you to make informed trading decisions, leading to potential financial success in the crypto market.
Introduction to Crypto Breakout Patterns

Source: bikotrading.com
Crypto breakout patterns represent significant shifts in market sentiment and price action. They signal potential price reversals or continuations, offering traders valuable opportunities for profit. Identifying these patterns requires understanding their characteristics and how they differ from other market movements. Recognizing these patterns allows traders to anticipate future price movements and potentially capitalize on lucrative trading opportunities.Breakout patterns stand out from ordinary price fluctuations due to their distinct characteristics.
These patterns typically involve a period of consolidation or sideways movement, followed by a decisive break above or below a key resistance or support level. This decisive move signifies a shift in market sentiment, indicating a potential trend reversal or continuation. This clear shift from a consolidation phase to a breakout phase is the key differentiator.
Key Characteristics of Breakout Patterns
Breakout patterns are characterized by a clear departure from a previous trading range, indicating a change in market momentum. This departure often involves a period of consolidation, creating a defined area of support or resistance. The break of this area is the pivotal moment signifying a potential shift in the trend. Breakouts are not simply temporary price fluctuations but rather indicate a significant shift in market dynamics, making them a key target for traders.
General Principles of Recognizing Breakout Patterns
Recognizing breakout patterns involves a combination of technical analysis and market observation. Understanding the historical price action and the current market context is crucial. Key indicators include identifying significant support and resistance levels. Support levels are areas where the price has historically found buying pressure, while resistance levels are areas where the price has met selling pressure.
Knowing how to spot breakout patterns in crypto is crucial for maximizing gains, but a well-diversified portfolio is equally important. Understanding how to build a diversified portfolio, like in How to Build a Diversified Crypto Portfolio for Maximum Gains , will help protect your capital and allow you to identify promising breakout patterns with more confidence. Ultimately, the best way to profit from crypto breakouts is by combining both a strong portfolio strategy with the ability to recognize telling signals in the market.
By analyzing the price action surrounding these levels, one can better understand the market’s potential for a breakout. Chart patterns, such as triangles, flags, and pennants, can also be indicative of potential breakouts.
Classification of Common Breakout Patterns
Breakout patterns can be categorized into several types, each with its own visual characteristics. This classification helps traders to identify and understand different breakout scenarios. The primary classification is based on the direction of the breakout – upward or downward. This distinction is vital in determining the potential market trend and the consequent trading strategy.
Common Types of Breakout Patterns
| Pattern Type | Visual Characteristics |
|---|---|
| Upward Breakout | Price action breaks above a significant resistance level, often after a period of consolidation or sideways movement. The volume associated with the breakout is typically high, suggesting increased buying interest. |
| Downward Breakout | Price action breaks below a significant support level, often after a period of consolidation or sideways movement. The volume associated with the breakout is typically high, suggesting increased selling pressure. |
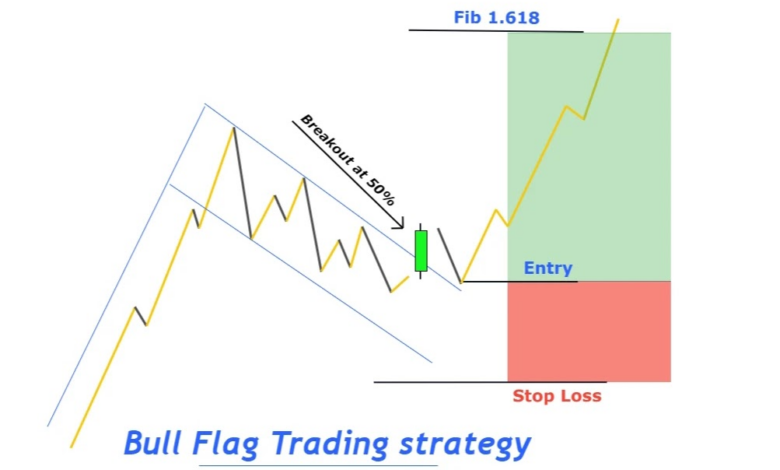
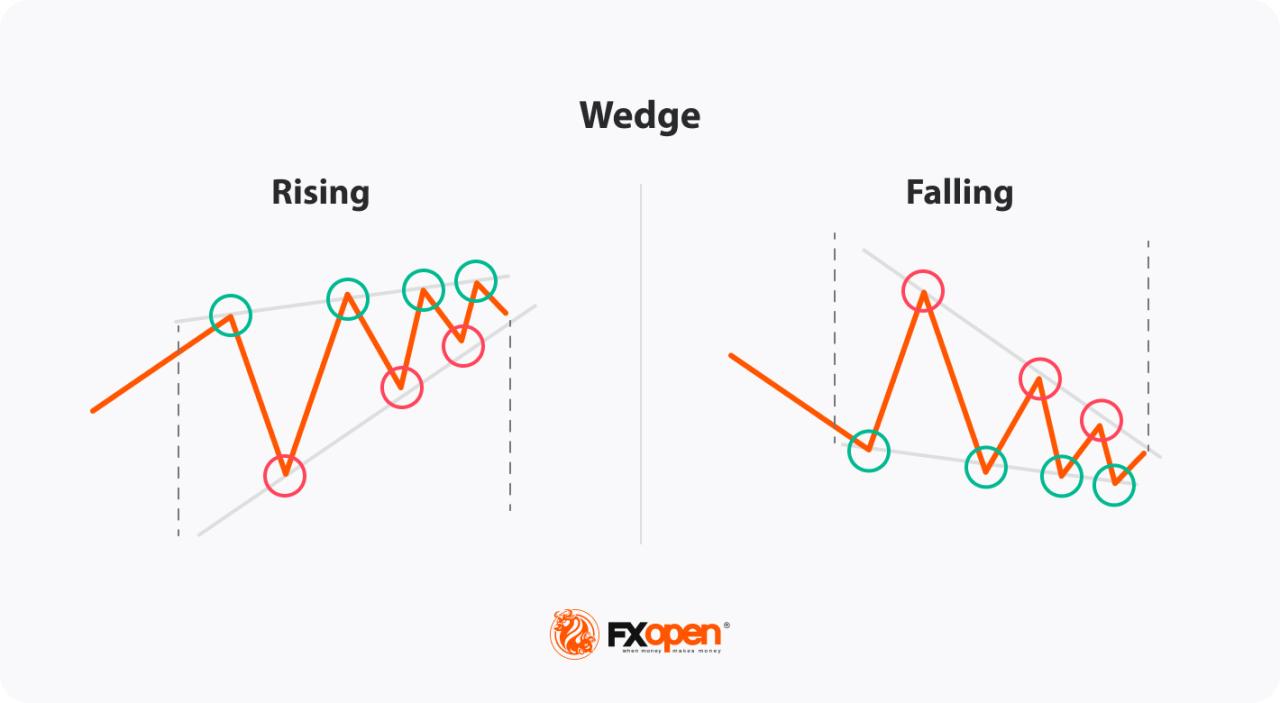
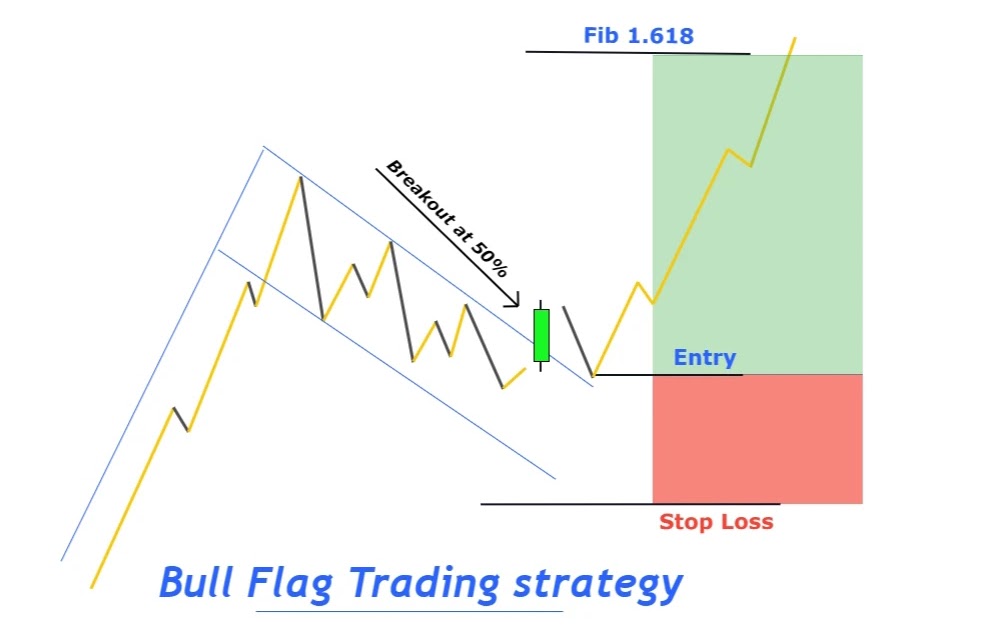
| Triangle Breakout | Price action consolidates within a triangle pattern before breaking out in one direction. The breakout often coincides with increased trading volume. |
| Flag/Pennant Breakout | Price action forms a flag or pennant pattern within a consolidation phase. A breakout from this pattern suggests a continuation of the existing trend. |
Identifying Breakout Patterns in Charts
Chart analysis is crucial for spotting crypto breakout patterns. Visual representations of price movements over time reveal hidden trends and potential turning points. By understanding how different chart types display these patterns, you can make more informed decisions about when to enter or exit trades. A deep dive into chart analysis helps separate noise from meaningful price action.Charting allows for a visual representation of price history, revealing hidden trends and patterns.
Recognizing breakout patterns in charts enables investors to anticipate potential price movements and adjust their strategies accordingly. This approach involves understanding how various chart types, like candlestick charts and line charts, depict price action. Crucially, understanding key technical indicators such as support and resistance levels, trend lines, and volume is essential.
Importance of Chart Types in Breakout Analysis
Different chart types offer varying perspectives on price action. Choosing the right chart type is vital for effective breakout pattern identification. Candle charts, for example, display price highs, lows, and closing values for a given period, providing a more detailed picture of price volatility and momentum.
Analyzing Different Chart Types
Candlestick charts, with their distinct body and wick formations, show the opening, closing, high, and low prices for a period. This detail reveals momentum and potential reversal signals. Line charts, in contrast, present a smoother representation of price trends, making it easier to spot overall uptrends or downtrends. Identifying the trend direction, and then spotting the breakout from that trend, is crucial.
Key Technical Indicators for Breakout Recognition
Support and resistance levels are horizontal lines that often act as barriers to price movements. When prices break through these levels, it suggests a potential breakout. Trend lines, drawn through significant price points, illustrate the prevailing trend direction. Breaking these trend lines can also indicate a shift in the trend. Volume analysis is another critical indicator.
Increased volume during a breakout suggests greater conviction in the price movement, strengthening the signal.
Knowing how to spot crypto breakout patterns is crucial for maximizing gains, but a robust, sustainable portfolio is equally important. For instance, understanding how to build a sustainable crypto portfolio that generates passive income, like detailed in this helpful guide How to Build a Sustainable Crypto Portfolio That Generates Passive Income , can provide a solid foundation for capitalizing on those breakout opportunities.
Ultimately, mastering both strategies is key to navigating the dynamic crypto market effectively.
Comparison of Chart Types for Breakout Analysis
| Chart Type | Strengths | Weaknesses |
|---|---|---|
| Candlestick | Detailed price action, visual representation of momentum, clear indication of volatility | Can be cluttered, potentially obscuring underlying trends |
| Line | Simple, easy to visualize overall trends, smooth representation of price movements | Lacks the detail of candlestick charts, potentially missing subtle price action patterns |
Examples of Breakout Pattern Identification
Let’s consider a hypothetical Bitcoin chart. A strong upward trend is established. If the price breaks above a significant resistance level, with high volume, this signals a potential breakout. The breakout from the trendline with substantial volume also suggests a strong buying pressure. The breakout above resistance with increased volume, combined with a continuation of the upward trend, indicates a positive signal.
A similar analysis can be applied to a downtrend, with prices breaking below support levels accompanied by increased selling pressure. This can be observed on any crypto asset chart, and is an important pattern to identify.
Analyzing Volume and Price Action During Breakouts: How To Spot Crypto Breakout Patterns For Maximum Gains
Breaking out of a consolidation pattern is a crucial moment in crypto trading, but simply seeing a price surge isn’t enough. To maximize gains, traders need to understand the supporting dynamics of volume and price action. A true breakout is backed by robust volume and consistent price movement. This section delves into how to interpret these crucial indicators.Price movements alone can be misleading.
A strong breakout needs to be accompanied by significant volume to validate the shift in market sentiment. Similarly, price action provides additional confirmation and helps identify the strength and sustainability of the breakout. Understanding the interplay between these two factors is key to spotting genuine breakout opportunities and avoiding false signals.
The Role of Volume in Confirming Breakout Patterns
Volume acts as a crucial filter, distinguishing between genuine market shifts and temporary fluctuations. High volume during a breakout signifies strong buyer interest and validates the upward movement. Conversely, low volume during a breakout can suggest a lack of conviction and potential for a reversal. The volume associated with the breakout must be proportional to the price movement.
A small price move with massive volume is often a red flag.
How Price Action Provides Additional Signals for Breakout Analysis
Price action, alongside volume, provides further insight into the strength and direction of a breakout. Sharp upward price movements during a breakout, accompanied by high volume, signify significant buyer pressure. Conversely, a gradual increase in price with low volume during a breakout suggests less conviction from buyers and a higher probability of a reversal. The manner in which the price breaks through resistance levels is significant.
A clean, decisive breakout is more reliable than a hesitant one.
How Volume and Price Action Interact During Breakout Periods
The interaction between volume and price action during breakouts is a critical element in successful trading. High volume often coincides with significant price movements, indicating strong market conviction. Conversely, low volume accompanying a price breakout raises concerns about the sustainability of the move. In short, a breakout needs both a clear price movement and high volume to be considered reliable.
Examples of How High Volume Can Support a Breakout
Consider a scenario where a cryptocurrency, previously consolidating, experiences a sharp upward price movement accompanied by a substantial increase in trading volume. This high volume suggests a strong buying pressure, signaling a genuine breakout. This is further corroborated if the price continues to move upward, demonstrating the persistence of this strong buying pressure.
Relationship Between Price Action, Volume, and Breakout Confirmation
| Price Action | Volume | Breakout Confirmation |
|---|---|---|
| Sharp, decisive upward movement | High | Strong |
| Gradual upward movement | Low | Weak |
| Hesitant or erratic price movement | Low | Suspect |
| Sharp upward movement, followed by consolidation | High, followed by lower volume | Potential reversal |
Understanding Support and Resistance Levels
Support and resistance levels are fundamental concepts in technical analysis, playing a crucial role in identifying potential breakout patterns. They represent price points where buying and selling pressure is often concentrated, creating areas of potential support (where the price is likely to find buyers) and resistance (where the price is likely to meet sellers). Understanding these levels can significantly enhance your ability to predict price movements and capitalize on breakout opportunities.Identifying these key levels on a chart provides insights into market sentiment and potential turning points.
Recognizing these patterns allows traders to anticipate possible price reactions and make informed decisions. This knowledge is especially valuable when combined with other technical indicators, like volume and trend analysis, to confirm the validity of potential breakouts.
Mastering breakout patterns is key to maximizing crypto gains, but identifying the next big thing is equally crucial. Understanding how to spot these patterns in the market is important, but equally vital is the ability to uncover the next potential 100x gem before it explodes into mainstream popularity. Check out this guide on How to Find the Next 100x Crypto Before It Goes Mainstream for insights on spotting promising projects.
Ultimately, a combination of pattern recognition and early identification will help you achieve the best returns in this volatile market.
Identifying Support and Resistance Levels on Charts
Support levels are horizontal lines on a chart that indicate price points where buyers are anticipated to step in and prevent a further decline. Conversely, resistance levels represent price points where sellers are likely to push the price back down. These levels are often identified by observing historical price patterns, significant lows, and highs. Common methods for identifying these levels include visual inspection, trend lines, and the use of support and resistance calculation tools.
Methods for Calculating Support and Resistance Levels
Various methods exist for determining support and resistance levels, each with its own strengths and limitations. A precise calculation depends on the desired level of accuracy and the specific chart.
| Method | Description | Advantages | Disadvantages |
|---|---|---|---|
| Moving Averages | Utilizing moving averages to determine support and resistance. | Simple to implement, readily available on most charting platforms. | May not capture short-term price fluctuations or sharp market movements. |
| Fibonacci Retracements | Employing Fibonacci retracement levels to identify potential support and resistance levels based on prior price movements. | Often used to identify key levels within established trends. | Can sometimes produce false signals, requiring careful validation with other indicators. |
| Trend Lines | Drawing trend lines based on historical price highs and lows. | Provides a visual representation of the trend, helping to define support and resistance. | Requires careful identification of trend direction and potential trend reversals. |
| Channel Lines | Creating channels based on historical price highs and lows. | Offers a wider perspective on potential price ranges. | May not be effective for short-term or highly volatile markets. |
Influence of Support and Resistance Levels on Breakout Patterns
Support and resistance levels act as crucial touchstones in the context of breakout patterns. When the price decisively breaks through a resistance level, it signals potential upward momentum, while a breakdown below a support level often indicates a downward trend. The strength of the breakout, measured by the volume accompanying the price movement, is a key factor to consider.
Examples of Identifying and Using Support and Resistance Levels to Predict Breakouts
Consider a cryptocurrency trading chart. If the price consistently bounces off a $10,000 resistance level, traders can anticipate a potential breakout when the price surpasses that level, assuming sufficient volume accompanies the move. Conversely, if the price repeatedly fails to break above the resistance, it may indicate that the upward momentum is weakening. A similar pattern holds for support levels.
Case Study: Bitcoin Breakout
During Bitcoin’s 2021 bull run, the price repeatedly tested the $60,000 resistance level. Subsequent breakouts above this level were often accompanied by significant volume increases, signaling strong buying pressure. This exemplifies how understanding support and resistance levels can enhance breakout pattern analysis.
Evaluating Risk and Reward Ratios for Crypto Breakouts
Source: googleusercontent.com
Successfully navigating the volatile crypto market requires a keen understanding of risk and reward. Breakout trades, while potentially lucrative, inherently carry higher risk. Thorough analysis of potential gains versus potential losses is crucial for maximizing profits and minimizing losses. This involves a meticulous approach to defining stop-loss orders and profit targets, crucial elements for responsible trading.Crypto breakouts, characterized by price movements beyond established support and resistance levels, offer significant opportunities for profit.
However, these opportunities come with inherent risks. A disciplined approach to risk management is paramount for success in breakout trades. Understanding risk-to-reward ratios is fundamental to making informed decisions and safeguarding capital.
Setting Stop-Loss Orders for Risk Management
Stop-loss orders are crucial for limiting potential losses during breakout trades. These predefined orders automatically sell a security when its price falls to a certain level. Implementing a robust stop-loss strategy is a proactive measure against adverse price movements.Setting a stop-loss order requires careful consideration of the current market conditions, the specific breakout pattern, and the anticipated price volatility.
Stop-loss orders should be placed at a level that allows for a reasonable degree of price fluctuation while still protecting capital. This level should be calculated based on a thorough analysis of the potential price retracement after the breakout. A stop-loss order that’s too close to the entry point may trigger prematurely and limit potential profits, while one that’s too far may not protect against significant losses.
Identifying Potential Profit Targets for Breakout Trades
Profit targets, or take-profit orders, define the price point at which a trader will lock in profits. This is an essential aspect of risk management. Determining a suitable profit target is crucial for maximizing returns while maintaining a balanced risk-reward profile.Profit targets should be established based on a comprehensive understanding of the breakout pattern, market trends, and the potential for further price appreciation.
For example, a measured move breakout could suggest a potential target based on previous highs, while a strong bullish volume breakout might justify a more aggressive target. This involves an understanding of the underlying asset and its historical price behavior.
Calculating Risk-to-Reward Ratios for Crypto Breakouts
The risk-to-reward ratio is a crucial metric for evaluating the potential profitability of a trade. It compares the potential profit against the potential loss. The ideal risk-to-reward ratio varies based on the trader’s risk tolerance and trading style. A higher risk-to-reward ratio may suggest higher potential returns, but also increased risk.
A common rule of thumb is to aim for a risk-to-reward ratio of at least 1:2 or 1:3. This means that for every dollar risked, the trader expects to potentially gain $2 or $3.
For example, if a trader anticipates a potential profit of $100 and is willing to risk $50, the risk-to-reward ratio is 1:2. This is a good starting point, but it’s crucial to tailor the ratio based on individual trading strategies and market conditions.
Risk Management Strategies for Breakout Trades
A structured approach to risk management is crucial for consistent success in breakout trades.
| Strategy | Stop-Loss Level | Profit Target | Risk-to-Reward Ratio |
|---|---|---|---|
| Conservative | 2-3% below entry point | 2-3 times the stop-loss | 1:2 to 1:3 |
| Moderate | 1-2% below entry point | 3-4 times the stop-loss | 1:3 to 1:4 |
| Aggressive | 0.5-1% below entry point | 5+ times the stop-loss | 1:5 or higher |
These examples highlight different risk tolerance levels and the corresponding risk-to-reward ratio and potential profit targets. Adjusting these levels based on individual risk tolerance and market conditions is vital.
Managing Risk During Crypto Breakout Trades
Source: googleusercontent.com
Navigating the volatile world of cryptocurrency breakouts requires a robust risk management strategy. While breakouts offer potential for significant gains, they also carry substantial risk of substantial losses. Thorough preparation and disciplined execution are crucial for maximizing potential profits while minimizing the impact of inevitable setbacks. Understanding and implementing appropriate risk management techniques is paramount to success in this arena.Effective risk management isn’t just about avoiding losses; it’s about strategically controlling the size and scope of potential losses to preserve capital and maintain the ability to participate in future opportunities.
This approach allows traders to ride the wave of a breakout while safeguarding their investment portfolio.
Risk Management Strategies for Crypto Breakouts
Successful crypto breakout trading hinges on a multi-faceted risk management approach. Different strategies cater to varying risk tolerances and trading styles. Employing a combination of techniques is often the most effective method for minimizing losses while maximizing potential profits.
- Stop-Loss Orders: Implementing stop-loss orders is a fundamental risk management technique. A stop-loss order automatically sells a position when the price falls to a predetermined level, limiting potential losses. This preemptive measure safeguards capital by preventing losses from escalating beyond a pre-defined threshold. For instance, if you anticipate a crypto asset to potentially break out to a high, but also recognize the risk of a sudden dip, a stop-loss order can help to prevent substantial losses.
- Take-Profit Orders: Take-profit orders automatically sell a position when the price reaches a specified target level, locking in profits. These orders provide a structured way to capitalize on a breakout while limiting the risk of missing a more significant price move. Setting a take-profit order is important to capitalize on price gains and protect profits, but it should not be the only method of risk management.
- Position Sizing: Determining the appropriate position size is critical. This strategy involves allocating a specific percentage of your capital to a particular trade, limiting the impact of any single position’s loss on your overall portfolio. This strategy is vital to prevent significant capital loss from a single, unfavorable trade. For example, allocating only 2% of your portfolio to a single trade significantly mitigates the impact of a losing position.
Diversification in Crypto Breakout Trades
Diversification is a crucial aspect of risk management in crypto breakout trades. Instead of concentrating all capital on a single asset, diversify across multiple cryptocurrencies. This strategy reduces the impact of a single asset’s price fluctuation on the overall portfolio.
- Reduced Risk Exposure: Diversifying reduces the risk exposure to a specific cryptocurrency. If one cryptocurrency experiences a sharp decline, the impact on the overall portfolio is minimized because other cryptocurrencies in the portfolio may experience price increases.
- Portfolio Resilience: Diversification enhances the resilience of your portfolio by lessening the impact of a negative price movement on a single asset. This allows traders to maintain a more stable and consistent trading experience.
Position Sizing in Breakout Trades
Position sizing is a key component of risk management in crypto breakout trades. It involves determining the appropriate amount of capital to allocate to a specific trade. Proper position sizing ensures that potential losses don’t jeopardize the entire trading capital.
- Capital Preservation: Proper position sizing helps to preserve capital. By limiting the amount of capital allocated to a single trade, traders can better withstand potential losses and maintain their overall investment capital.
- Profitability: Strategically allocated position sizes can enhance profitability. By carefully selecting the appropriate position sizes, traders can potentially capture a higher percentage of returns on successful trades while minimizing the impact of losses.
Implementing Risk Management Strategies
To illustrate these strategies, consider a trader with a $10,000 portfolio. Using 2% position sizing, they allocate $200 to a breakout trade on a specific cryptocurrency. A stop-loss order at a predetermined level limits losses to $200, while a take-profit order ensures profits are captured at a pre-determined price. By diversifying into other cryptocurrencies, the trader reduces risk exposure.
Risk Management Strategy Comparison
| Strategy | Pros | Cons |
|---|---|---|
| Stop-Loss Orders | Limits potential losses, protects capital | May result in missing out on potential profits if the price rebounds |
| Take-Profit Orders | Locks in profits, ensures profits are captured | May miss out on potential further price increases |
| Position Sizing | Preserves capital, limits impact of single losses | Requires discipline, may reduce potential profits |
| Diversification | Reduces risk exposure, enhances portfolio resilience | May require more research, potentially slower gains |
Advanced Breakout Pattern Strategies
Unveiling advanced breakout patterns unlocks a deeper understanding of market dynamics, enabling more nuanced predictions and potentially higher returns. Beyond the basic breakout, these strategies incorporate intricate price action and volume cues to refine entry and exit points. Understanding these patterns requires a keen eye for detail and a solid grasp of fundamental principles.
Breakout with Consolidation
Consolidation phases before a breakout often provide crucial insights into market sentiment and potential price direction. These periods, characterized by a range-bound price action, offer a valuable opportunity to identify underlying strength or weakness. A successful breakout from a well-defined consolidation zone usually signifies a decisive shift in market momentum.
Engulfing Patterns
Engulfing patterns, a significant part of technical analysis, signal a strong directional shift in the market. These patterns involve a larger candle (either a bullish or bearish engulfing candle) engulfing a preceding candle. Recognizing these patterns requires an understanding of candle body size, wick length, and overall market context. The significance lies in the clear signal of changing market sentiment.
Identifying Advanced Patterns on Charts
Chart analysis is paramount in identifying advanced breakout patterns. Careful observation of price movements, candle formations, and volume dynamics is crucial. Tools like candlestick patterns, volume profiles, and trend lines assist in pinpointing potential breakout points. The key is to look for confluence of signals rather than isolated occurrences.
Significance of Multiple Indicators
Employing multiple indicators enhances the accuracy of breakout pattern identification. Combining volume analysis with price action, support/resistance levels, and fundamental factors offers a more holistic view of the market. A combination of indicators acts as a filter, reducing false signals and improving the reliability of the breakout prediction.
Characteristics and Relation to Other Patterns
Advanced breakout patterns often combine elements of established patterns like continuation patterns or reversal patterns. For example, a breakout with consolidation may be followed by a continuation pattern. The interplay between different patterns provides context and deeper insights into market behavior.
Combining Advanced Patterns with Fundamental Analysis
Fundamental analysis plays a crucial role in validating breakout predictions. Combining fundamental factors, such as company earnings reports, economic indicators, or regulatory changes, with technical indicators adds another layer of analysis. This comprehensive approach provides a more robust predictive model, significantly increasing the probability of successful trades.
Backtesting Breakout Strategies for Validation
Backtesting is a crucial step in validating any trading strategy, especially in the volatile crypto market. It allows you to simulate the performance of your breakout strategy using historical data, identifying potential strengths and weaknesses before deploying capital in the live market. This process provides insights into the strategy’s profitability, risk levels, and overall viability.
Methodology for Backtesting Breakout Strategies
Backtesting a breakout strategy involves replicating the trading process on historical price data. This includes defining the specific breakout patterns you want to identify, setting entry and exit rules, and calculating the profitability of each trade. Crucially, the backtesting environment should closely mirror the actual trading conditions, including slippage and transaction costs, for a realistic evaluation.
Importance of Historical Data for Validation
Using historical data is essential for backtesting because it allows for an objective assessment of a strategy’s performance. By analyzing past market behavior, you can understand how the strategy would have performed under various market conditions. This allows you to refine the strategy and reduce the potential for unforeseen issues in live trading. However, keep in mind that past performance is not indicative of future results.
Tools and Techniques for Effective Backtesting
Several tools and techniques facilitate effective backtesting. Spreadsheet software like Excel or Google Sheets can be used for simpler strategies. Dedicated trading platforms and quantitative analysis software offer more sophisticated features, allowing for the integration of complex indicators and advanced algorithms. Python libraries like Pandas and backtesting libraries provide robust frameworks for comprehensive backtesting, including detailed analysis and visualization capabilities.
Crucially, the chosen tools must accurately reflect the nuances of the chosen trading strategy, including slippage and commissions.
Metrics for Strategy Evaluation
Several key metrics are used to evaluate the effectiveness of a breakout strategy. These include:
- Profit Factor: The ratio of average winning trades to average losing trades. A high profit factor indicates a profitable strategy, with more money generated from winning trades than lost on losing trades. A profit factor of 2 indicates that for every $1 lost on losing trades, $2 is earned on winning trades.
- Win Rate: The percentage of trades that resulted in a profit. A high win rate suggests the strategy’s ability to generate profits consistently.
- Average Trade Duration: The average time a trade remained open. This helps understand the strategy’s responsiveness to market changes.
- Maximum Drawdown: The largest percentage decline from a peak to a trough in the account equity during the backtesting period. A smaller maximum drawdown indicates lower risk.
- Sharpe Ratio: A measure of risk-adjusted return, reflecting the excess return per unit of risk. A higher Sharpe ratio suggests better risk-adjusted performance.
Example Backtest Results Table, How to Spot Crypto Breakout Patterns for Maximum Gains
This table summarizes the results of a backtest of a breakout strategy. The data shows how the strategy performed over a 12-month period. It is essential to understand that results will vary based on the specific parameters and conditions of the strategy.
| Metric | Value |
|---|---|
| Total Trades | 100 |
| Winning Trades | 65 |
| Losing Trades | 35 |
| Win Rate | 65% |
| Profit Factor | 2.1 |
| Average Trade Duration | 3 days |
| Maximum Drawdown | 12% |
| Sharpe Ratio | 1.5 |
Concluding Remarks
In conclusion, mastering crypto breakout patterns is a crucial step in navigating the dynamic crypto market. By understanding the fundamentals of chart analysis, volume, price action, support and resistance, and risk management, you can significantly improve your trading decisions. This guide equips you with the knowledge and strategies to identify and capitalize on breakout opportunities. Remember that consistent practice and a well-defined risk management plan are key to success in this ever-evolving market.
Now, go forth and conquer those breakout opportunities!
Question & Answer Hub
What are some common mistakes traders make when identifying breakout patterns?
Overlooking volume confirmation, relying solely on price action without considering support/resistance levels, and not properly calculating risk-to-reward ratios are frequent pitfalls. It’s essential to consider all these elements for a comprehensive analysis.
How can I tell if a breakout is genuine or a temporary fluctuation?
A genuine breakout often shows sustained volume increases alongside price movement. A temporary fluctuation might see price movement without significant volume changes, or the price might quickly reverse after the initial breakout.
What are the best chart types for analyzing breakout patterns?
Candlestick charts are highly effective for visualizing price action and volume, while line charts offer a simpler, more streamlined approach to identifying overall trends. Experiment with both to find what works best for your style.
How frequently should I review my breakout strategy and adjust my approach?
The crypto market is constantly evolving. Regular reviews and adjustments to your strategy based on market conditions are essential to maintaining effectiveness and maximizing potential gains.